SWIT
The SWIT tool will only be enabled if you have the appropriate data contained within the connected workspace.
How to Use
-
Click the SWIT button from the Getech Globe toolbar

-
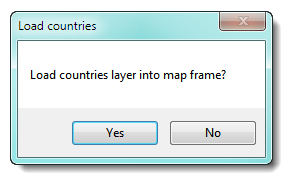
If the data frame does not already have the ESRI Countries (Line) layer loaded, you will be prompted to load this layer. This can be useful if you need a
spatial context to assist you with choosing an area to query for analysis (especially if starting with a blank data frame).
-
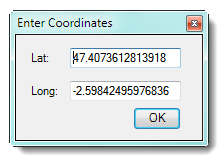
You may right-click on the map and enter the exact coordinates you want to query – see the example below:
-
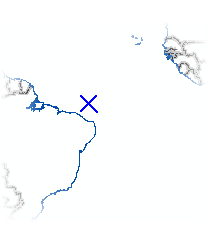
Or you may left-click on the map and a small blue cross will appear where you have clicked – see the example below:
-
Whist the tool is calculating the results you will be presented with a "busy" message.
-
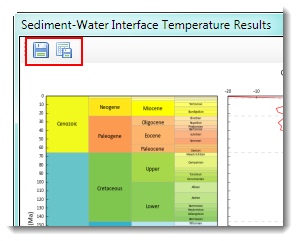
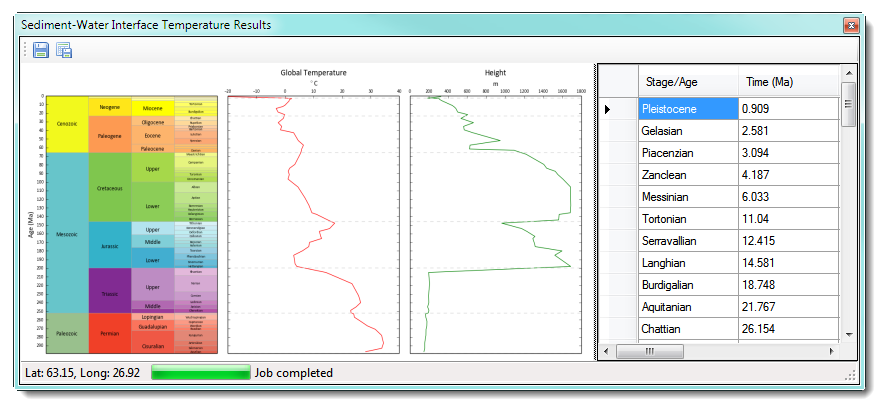
When the analysis has finished, the dialog screen will change, displaying a chronostratigraphy chart and global temperature and height graphs showing changes through
time reading downwards.
There is also a table of results that can be better seen if you expand the size of the dialog screen.
-
You may output the graphs to a graphic file format (left-hand-side save button) or export the figures out to a CSV format (right-hand-side save button) – see the example below: