Overview - Quick Start
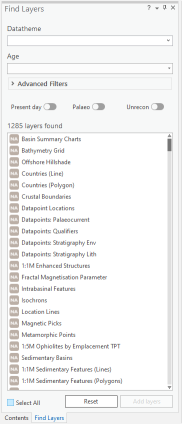
Globe Guides and Reports
The Globe User Guides and Reports section contains PDFs that describe relevant scientific background, Getech's methodologies behind Globe's data and analysis tools, user Tips, and any data limitations.

Globe Data Status
Globe for ArcGIS Pro is a "Cloud First" application and accesses all data from the Cloud.
Before you can start using Globe, you must be a member of the data group. Details should have been sent to your organisation about this process. If you have not been added to the data group by Getech, the toolbar will disabled and you will not have acceess to the data.
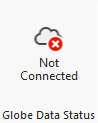
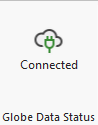
The default status when you first start ArcGIS Pro is that you will not be connected to the Globe Data Group. Press the button to "connect". If successful you the button will change to a "Connected" state.
If not successful you will be presented with this message:
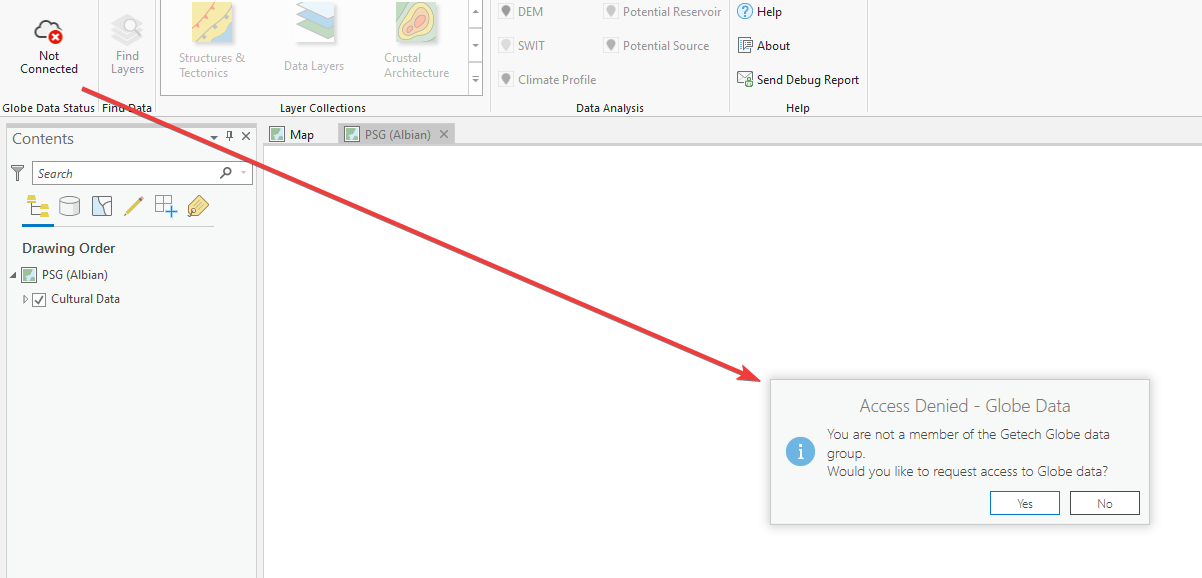
Press "Yes" to request access from Getech to be added to the data group. In due course you should hear back from Getech that you have added to the data group.
- A consistent data set naming convention is applied whenever you add a layer into ArcMap. It is descriptive and informative enough that once you have built your project, you and your colleagues will instantly be able to recognise what each layer consists of.
- The correct symbology (as defined by Getech) is automatically applied to a layer for both vector and raster data sets.
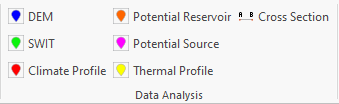
- DEM - The DEM Tool intersects the topography and bathymetry producing a table and graphical image of height data over time. The DEM tool is useful when determining major changes in elevation and when they temporally happened, e.g. how many orogenies have impacted an area and for how long. Differing to the other sets of tools, the DEM tool uses data from Getech plate model v4.1 (1:5M palaeogeographies: Mega-Regional Explorer Map Series).
- SWIT - This innovative tool allows users to figuratively drill-down through the sub-surface by intersecting the Earth system modelling (ESM) and digital elevation model (DEM) layers to provide a sediment-water interface temperature (SWIT) value for any location (be it onshore or offshore). The SWIT value can then be input into basin modelling assessments or used for other tasks.
- Climate Profile - The Climate Profile Tool compiles the mean annual atmospheric temperature, the average daily precipitation over one year, the average daily precipitation minus average daily evaporation, and Biome 4CO2 data over time to create climate curves for the specified geographical locations and stages of interest. The tool works at Present Day locations by the user selecting a point of interest on the map. Data relevant to that point are calculated and returned as a downloadable preformatted figure; this figure will also record the latitude and longitude of the point selected.
- Potential Reservoir -This tool interrogates various ESM layers, providing the user with a simple way of assessing variation through time of critical factors that may influence the development and quality of potential reservoir intervals. The user can then focus on targeted investigations only on the most favourable stratigraphic intervals.
- Potential Source - This tool intersects selected ESM layers that may indicate the presence and quality of potential source rocks in an area of interest. The ability to visualise these data against a stratigraphic column can provide an indication of the stratigraphic position of potential source rocks pinpointing areas for further investigation.
- Thermal Profile - Using the Temperature Depth grids from Getech’s Thermal Mapping module, a profile is generated for a selected Present Day location. The tool provides a graphical and numerical output of temperature (°C) with depth (km), from the land surface to the Curie Temperature Depth (CTD).
- Cross Section - This generates a cross-section of Present Day data which includes, height above or below sea-level, Depth-to-Basement and Depth-to-Moho (where licensed), Curie Temperature Depth, and crustal types, along a user defined profile line. A map is also generated showing the location of this profile line.