Cross Section
The Cross Section tool will only be enabled if you have the appropriate data contained within the connected workspace.
How to Use
-
Click the Cross Section button from the Getech Globe toolbar

-
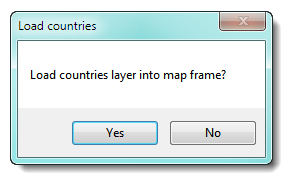
If the data frame does not already have the ESRI Countries (Line) layer loaded, you will be prompted to load this layer. This can be useful if you need a
spatial context to assist you with choosing an area to query for analysis (especially if starting with a blank data frame).
-
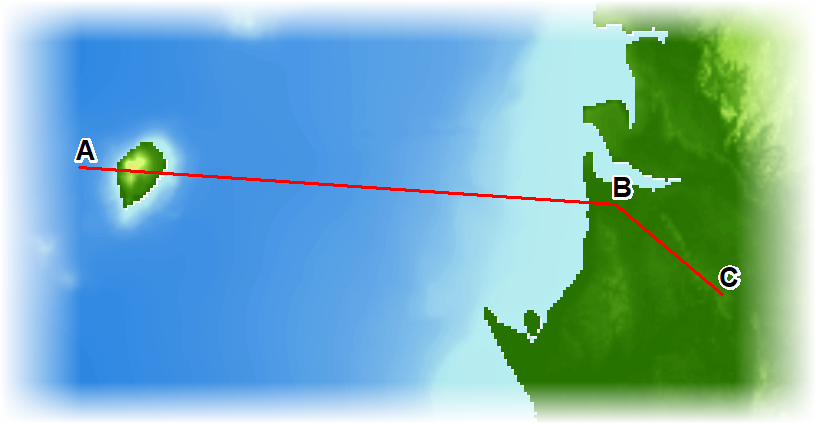
To start a cross section you are sketching a polyline on the map. Your first left mouse click will create and "A" plot, the start of the polyline.
Subsequent left mouse clicks will create, "B", "C", "D" and so on (up to "Z"). Double click to finish sketch.
-
Whist the tool is calculating the results you will be presented with a "busy" message.
-
When the analysis has finished, the dialog screen will change, displaying a chronostratigraphy chart and global temperature and height graphs showing changes through
time reading downwards.
There is also a table of results that can be better seen if you expand the size of the dialog screen.
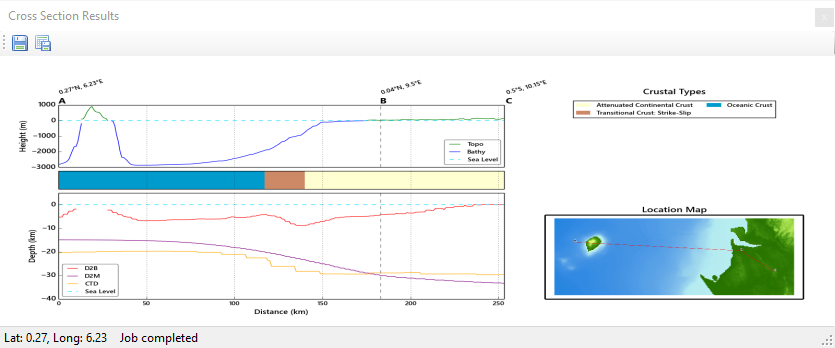
-
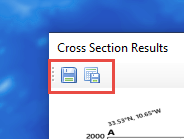
You may output the graphs to a graphic file format (left-hand-side save button) or export the figures out to a CSV format (right-hand-side save button) – see the example below: